the following info is courtesy of the Naples Area Board of Realtors...
1st Quarter 2015 - Buyers Shift Focus to Condo Market
Overall activity in the Naples area real estate market across all price categories remains steady, according to the First Quarter 2015 Market Report released by the Naples Area Board of REALTORS® (NABOR®), which tracks home listings and sales within Collier County (excluding Marco Island). Most notable in the report was the $300,000 - $500,000 price category for condominiums in which the overall closed and pending sales increased by double digits in the first quarter of 2015. Statistics show a recent shift in buyer focus from single-family homes to condominiums.
Broker analysts reviewing the First Quarter 2015 Market Report agree that a new trend may be emerging, as the report showed condominiums outperforming single-family home sales. As such, these analysts predict condominiums will see continued rise in activity moving into summer.
Overall inventory for the $300,000 - $500,000 price category in the first quarter of 2015 increased 14 percent from 934 homes in the first quarter of 2014 to 1,061 homes in the first quarter of 2015. Only the inventory in the over $2 million price category had a larger increase - 18 percent - expanding from 400 homes in the first quarter of 2014 to 471 homes in the first quarter of 2015.
Cash buyers made up 73% of all home sales during the first quarter of 2015. Strict lending standards combined with low inventory give the advantage to cash buyers in the current housing market.
The First Quarter 2015 and March 2015 Market Reports reflect exactly what all three economic experts predicted at NABOR®'s 4th annual Economic Summit: that the real estate industry in Florida is very good and will continue to stay very good through 2015.
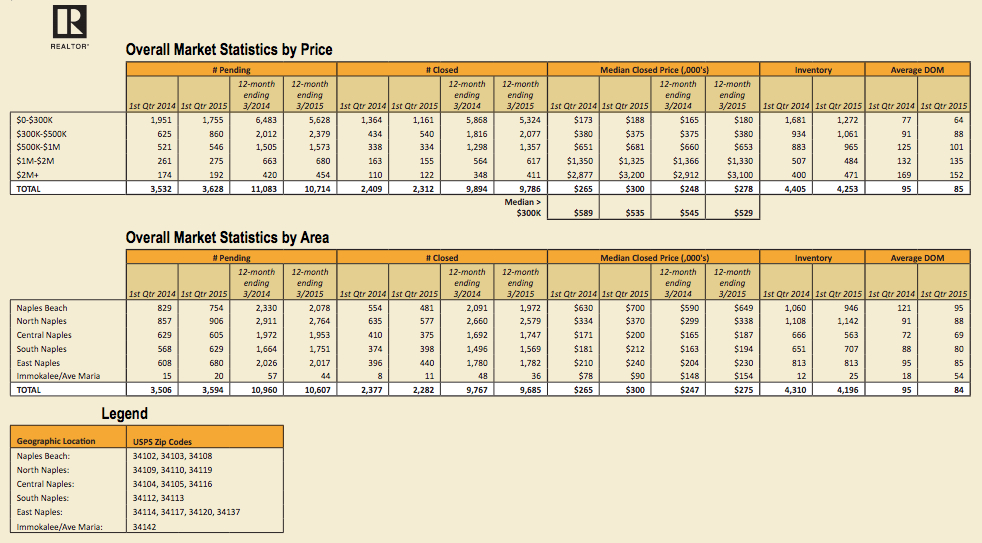
The NABOR® 1Q 2015 Market Report provides comparisons of single-family home and condominium sales (via the Southwest Florida MLS), price ranges, and geographic segmentation and includes an overall market summary. The NABOR® 1Q 2015 sales statistics are presented in chart format, including these overall (single-family and condominium) findings:
- Overall pending sales increased 3 percent from 3,532 in 1Q 2014 to 3,628 in 1Q 2015.
- Pending sales in the single-family home market increased 5 percent from 1,563 single-family homes in 1Q 2014 to 1,634 single-family homes in 1Q 2015.
- Pending sales in the condominium market increase 1 percent from 1,969 condominiums in 1Q 2014 to 1,994 condominiums in 1Q 2015.
- Overall closed sales decreased 4 percent from 2,409 in 1Q 2014 to 2,312 in 1Q 2015.
- Closed sales for single-family homes decreased 13 percent in the $0 - $300,000 price category from 473 single-family homes in 1Q 2014 to 412 single-family homes in the 1Q 2015,
- Closed sales for single-family homes increased 14 percent in the $300,000 - $500,000 price category from 264 single-family homes in 1Q 2014 to 300 single-family homes in 1Q 2015.
- Overall median closed price increased 13 percent from $265,000 in 1Q 2014 to $300,000 in 1Q 2015.
- Overall median closed price for homes over $2 million increased 11 percent from $2,877,000 in 1Q 2014 to $3,200,000 in 1Q 2015.
- Median closed price for condominiums in the $2 million and above price category decreased 13 percent from $2,775,000 in 1Q 2014 to $2,405,000 in 1Q 2015.
- Overall inventory decreased 3 percent from 4,405 homes in 1Q 2014 to 4,253 homes in 1Q 2015.
- Inventory of single-family homes in the $0 - $300,000 price category decreased 28 percent from 537 single-family homes in 1Q 2014 to 385 single-family homes in 1Q 2015.
- Inventory of single-family homes in the $500,000 - $1 million price category increased 21 percent from 529 in 1Q 2014 to 640 in 1Q 2015.
- Inventory for condominiums in the $2 million and above price category increased 77 percent from 39 in 1Q 2014 to 69 in 1Q 2015.
- Average days on market decreased 11 percent from 95 in 1Q 2014 to 85 in 1Q 2015.
The NABOR® March 2015 Market Report was also released and reflected these overall (single-family and condominium) findings:
- Overall pending sales increased 9 percent from 1,399 homes in March 2014 to 1,520 homes in March 2015.
- Overall closed sales increased 3 percent from 981 homes in March 2014 to 1,014 homes in March 2015.
- Overall median closed price increased 12 percent from $248,000 in the 12-months ending March 2014 to $278,000 in the 12-months ending March 2015.
- Overall median closed price in the $0-$300,000 category increased 9 percent from $165,000 in the 12-months ending March 2014 to $189,000 in the 12-months ending March 2015.
- Overall inventory decreased 3 percent from 4,405 homes in March 2014 to 4,253 in March 2015.
- Average days on market decreased 16 percent from 94 days in March 2014 to 80 days in March 2015.
Review the Q1 2015 Sales Statistics

.jpg)